

Graphs
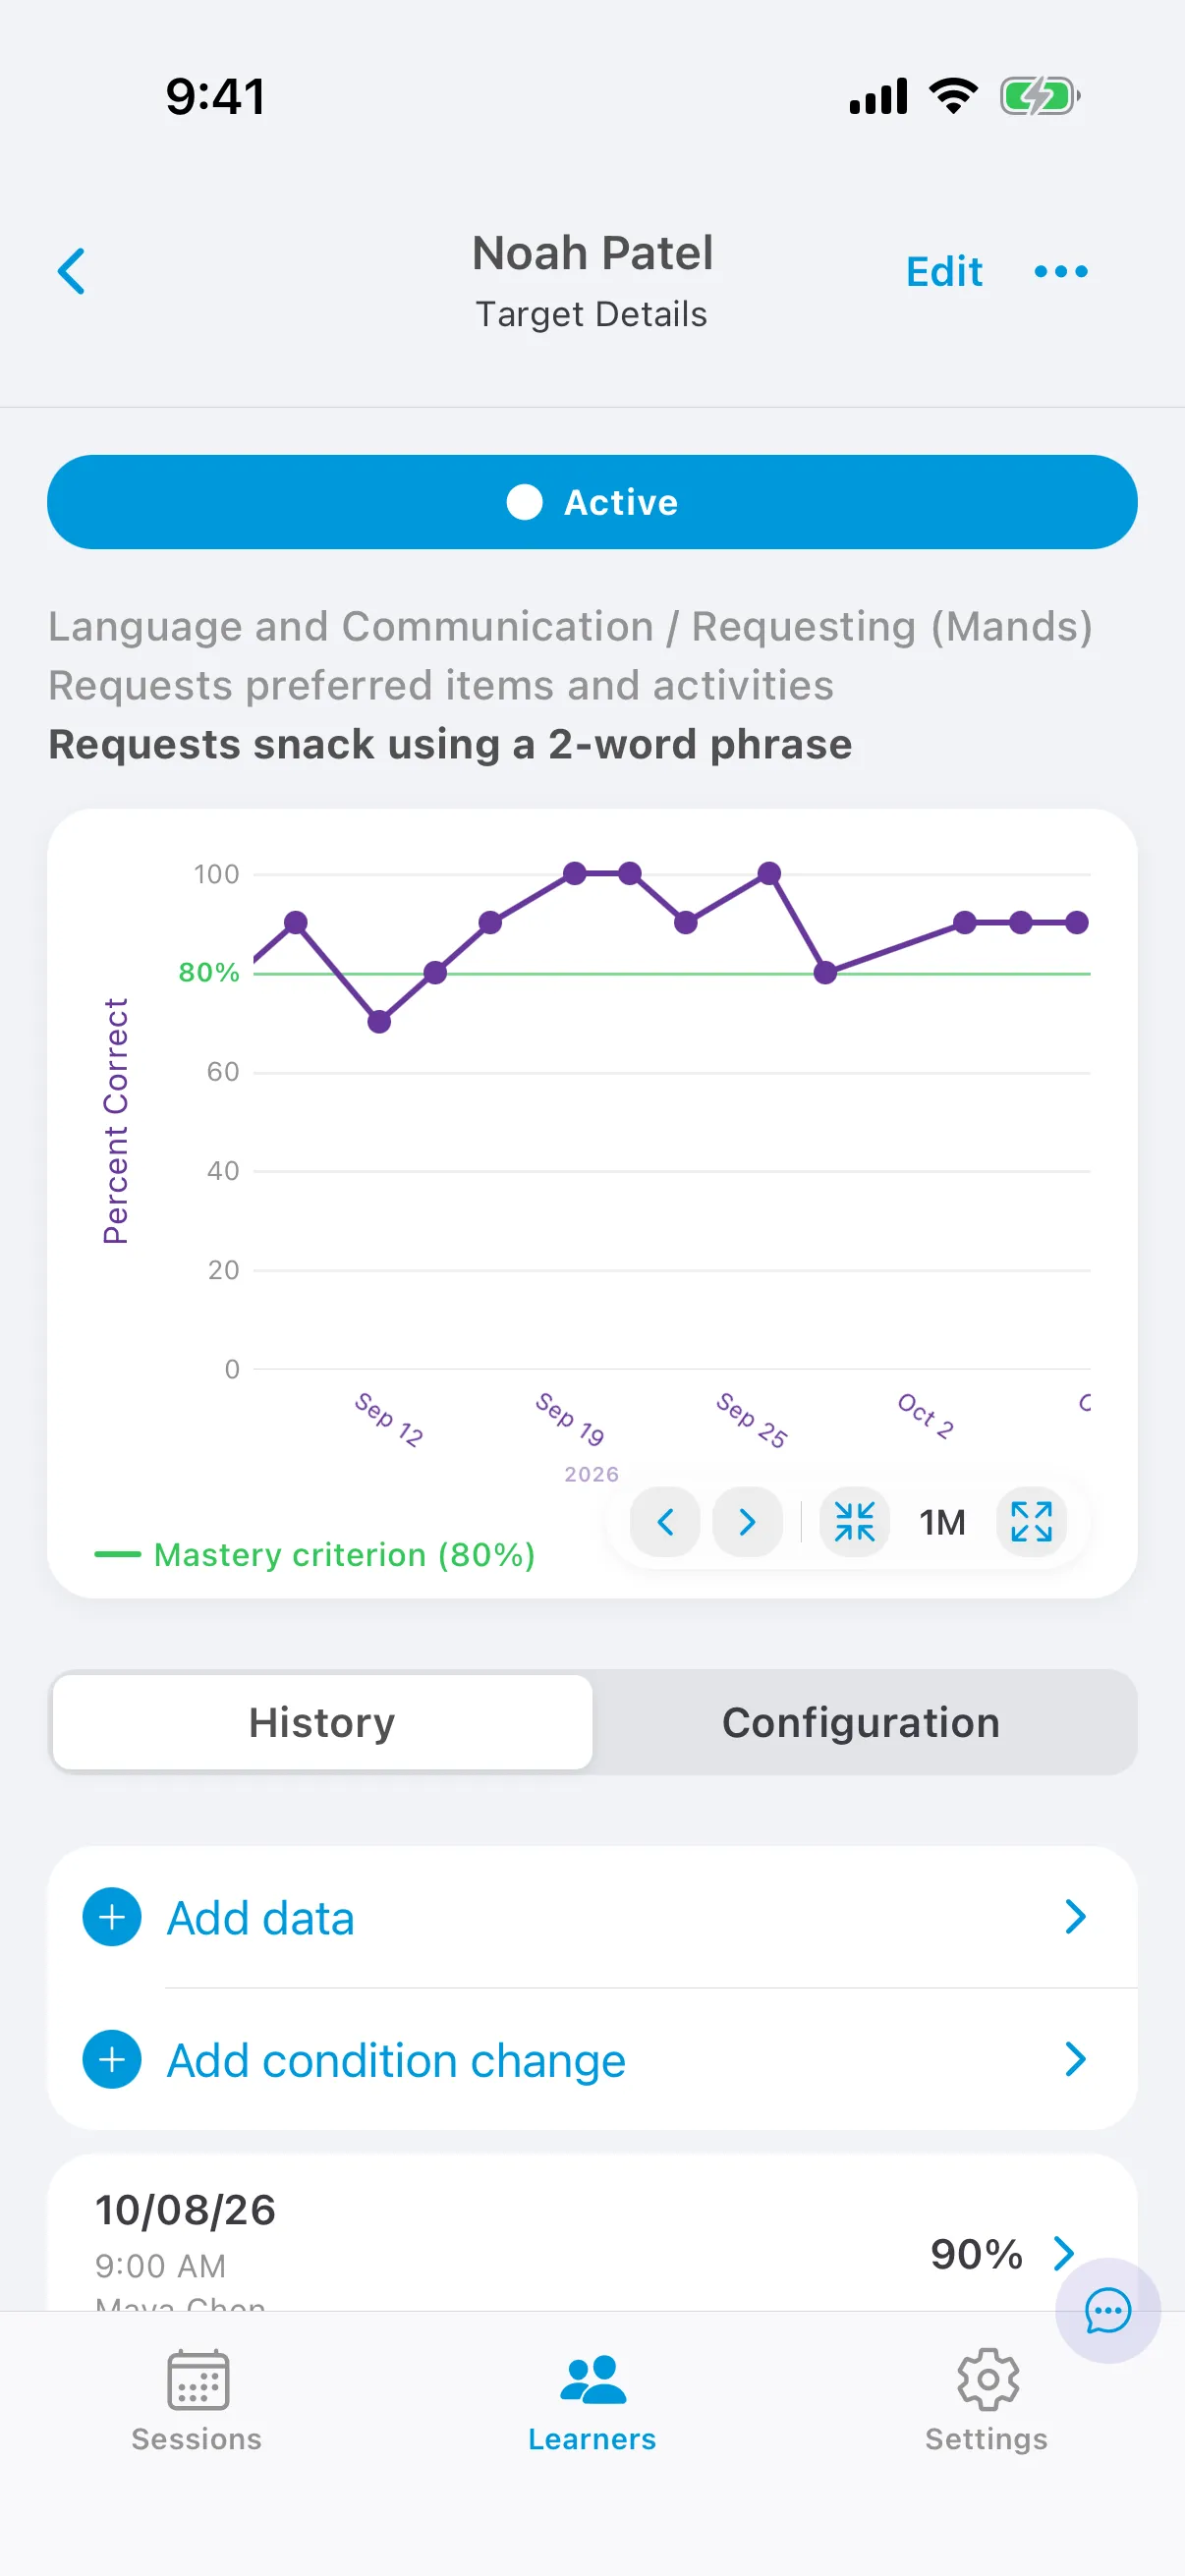
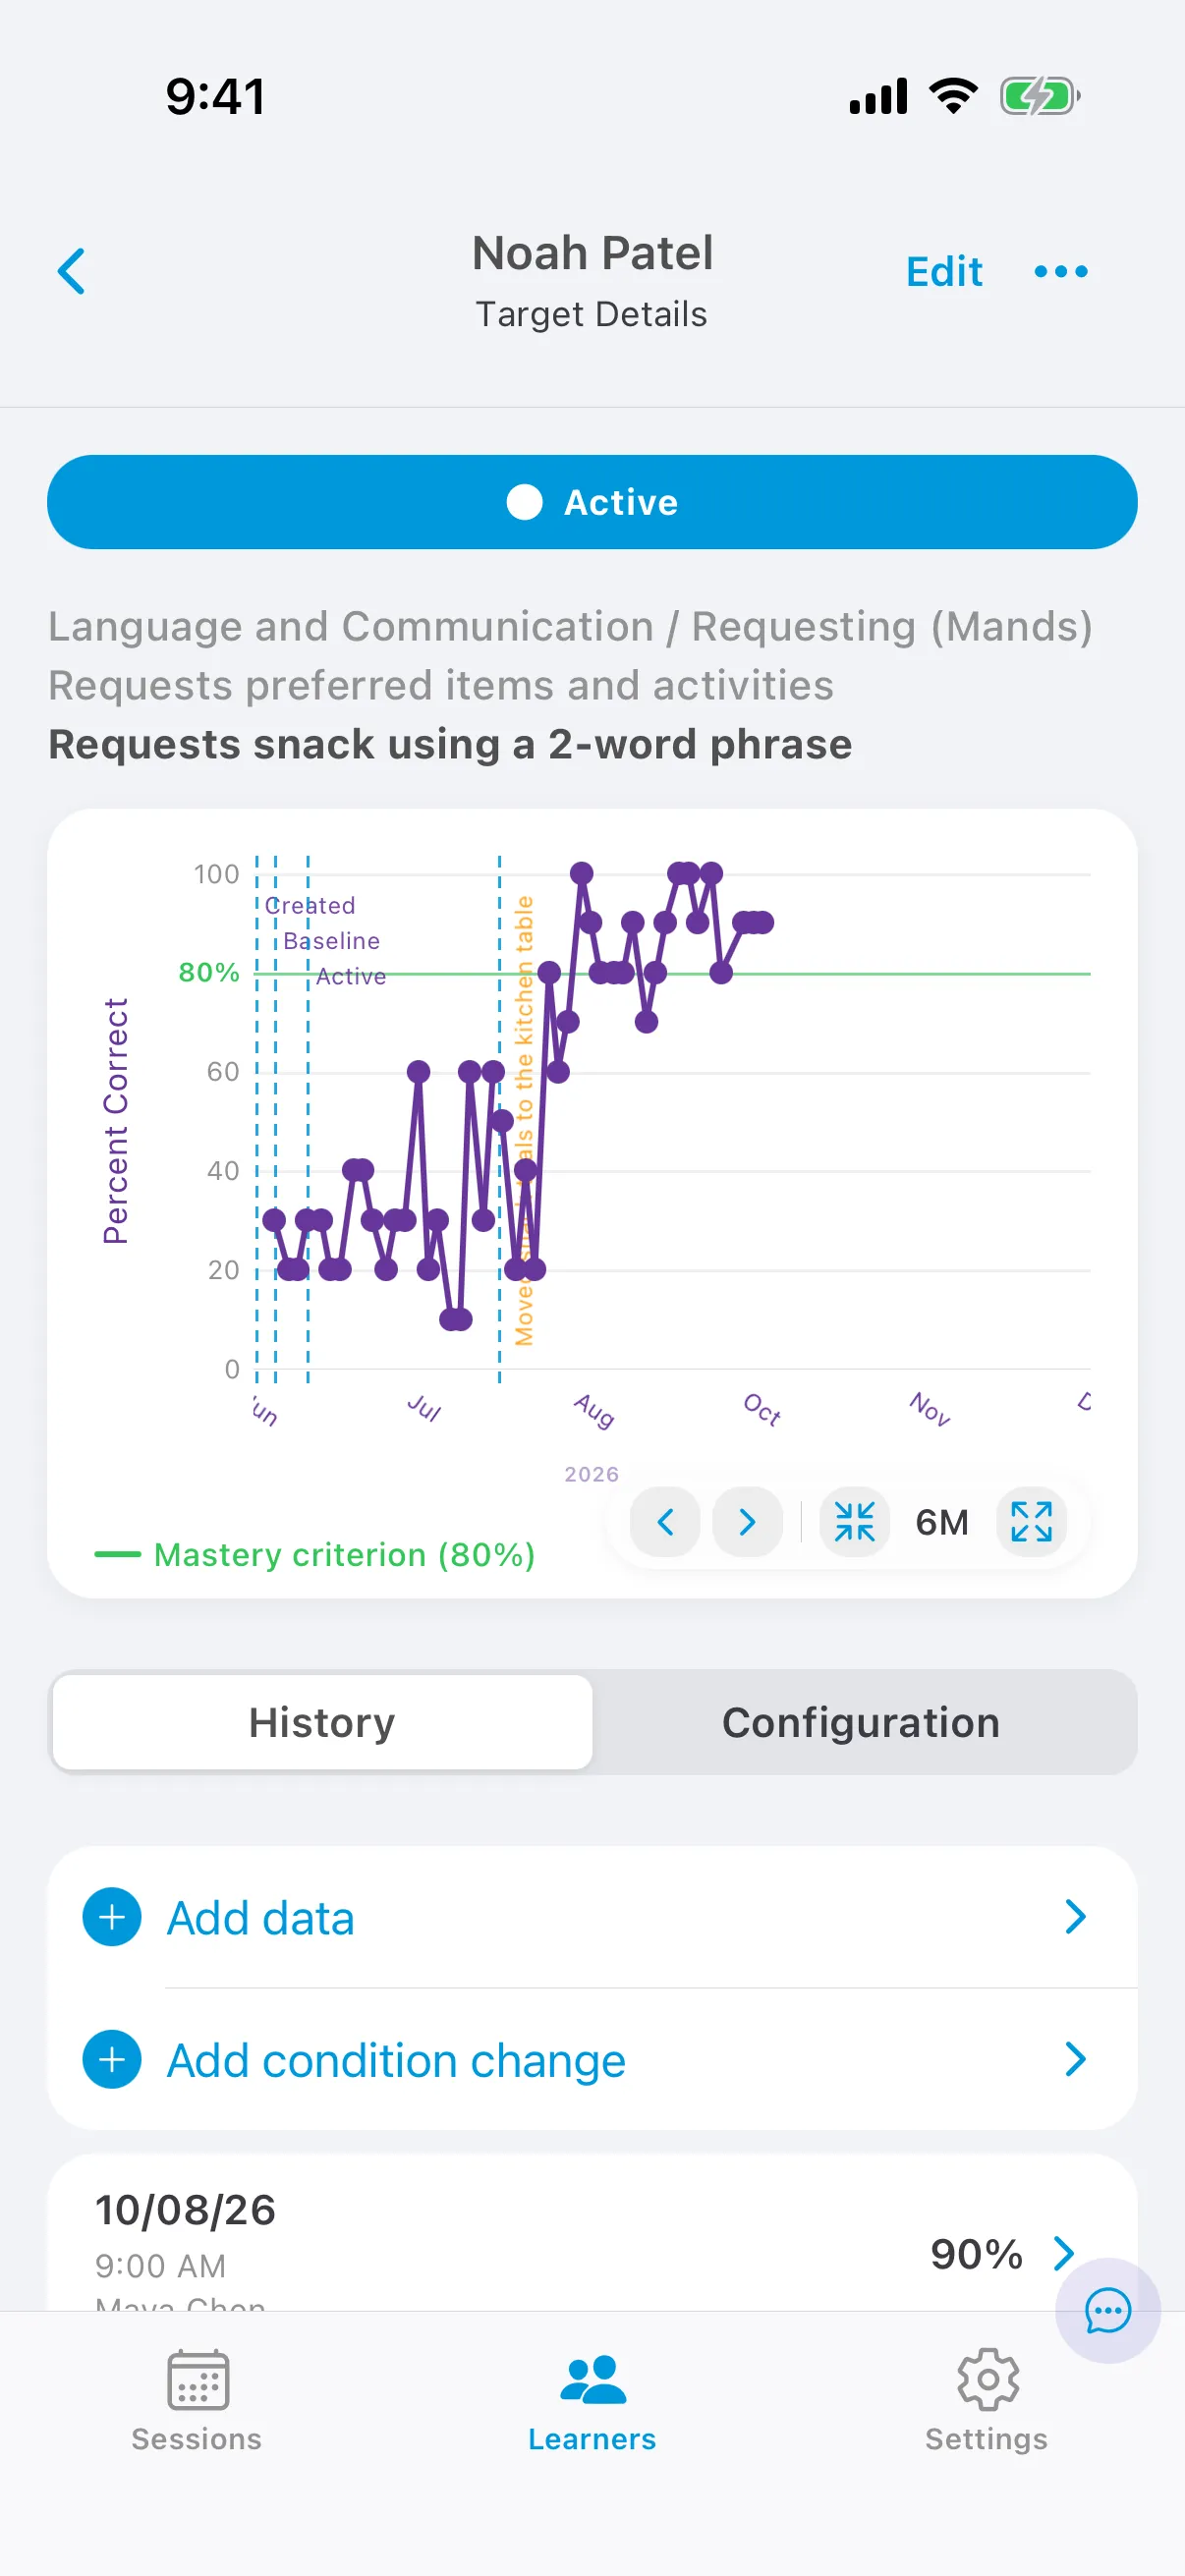
Open a target from the care plan to see its graph. The graph plots the learner’s scores over time.
Reading the graph
Section titled “Reading the graph”- The Y axis depends on the form of measure: percent correct, count, or time.
- The X axis is the date. Several data points on the same day are combined: counts and total durations are added; percentages, average durations and rates are averaged.
- The green line is the mastery criterion.
- Phase-change lines are added automatically when the target’s phase changes.
- Condition-change lines mark changes you record, such as a new setting.
- Prompt-change lines appear when the active prompt level of a target with fading across sessions changes.
Preliminary scores, where fewer than the minimum trials were collected, aren’t plotted. They show in orange in the target’s history.
Change the date range
Section titled “Change the date range”Use the zoom buttons under the graph to show more or less time (from one week up to everything), and the arrows to move back or forward in time.
History
Section titled “History”The History tab lists everything that happened to the target, newest first: session data, data added after a session, phase changes and condition changes. Tap an item for its details.
Add a data point
Section titled “Add a data point”- Open a target in Baseline, Active, Generalization or Maintenance.
- On the History tab, tap Add data.
- Enter the score and the date, and save.
Add a condition change
Section titled “Add a condition change”- Open the target and tap Add condition change.
- Enter a label, such as “Moved to clinic”, and the date.
- To add the same line to every graph for this learner, turn on Apply to all.
- Save.